History AI - Image Duplicates and Distribtion
Scraping Results
This table shows some metadata about the images scraped.
| Prefix | Size (GB) | Images | Distinct Images | Duplicate Images | Duplicate Images % |
|---|---|---|---|---|---|
| A | 12 | 71077 | 48126 | 22951 | 32.3% |
| B | 456 | 1672477 | 1667500 | 4977 | 0.3% |
| C | 48 | 290248 | 278891 | 11357 | 3.9% |
| D | 29 | 122001 | 121977 | 24 | 0.0% |
| E | 29 | 212701 | 209391 | 3310 | 1.6% |
| F | 5 | 40301 | 40301 | 0 | 0.0% |
| G | 0.04 | 216 | 215 | 1 | 0.5% |
| ———— | ————— | —————- | ——————- | ————– | —————- |
| Total | 579 | 2409021 | 2366401 | 42620 | 0 |
The scraping process resulted in 2.4M images. Current cost is $0.374/day in storage for 543.35GB. From the looks of it, GCP buckets are smart enough to save on storage by not duplicating images that are identical. This size discrepancy was also a hint that lead to the duplicate analysis.
A most notable element in the table above is the uneven distribution of images across the various prefixes. Prefix B contains ~69% of images while A contains only 3%.
Additionally it was unexpected to find so many duplicate images under some Prefixes. Prefix A clearly stands out.More on this later as there are posible domain-specific reasons for this. While I was originally tempted to filter out diplicates to save on OCR cost, the bigger picture shows that the total duplicate count it actually quite insignificant. The effort will be better spent on other cost-saving strategies.
The OCR price of $1.50/1000 pages leads to a first cost estimate of $3,614 USD. Since this amount is significantly higher than the $1000 budget cost-saving measures are required. Since the documentation states that a page is defined as “a single side of a sheet of paper”, one possible solution is the aggregation of several images into a single “page”.
Image Prefix Distribution
To better understand the distribution of images across the various prefixes, I created a histogram of the image counts. Data was fetched from google Object handlers then stored in a SQL database (ie. Cockroachdb) while filtering out duplicate images. Eventually the code to filter out was commented out and the focus was put entirely on getting metadata into SQL. This task cost about $1.004 USD in Regional Standard Class A Operations. See CockroachDB Local for information on the database choice and configuration.
My SQL skills are rudimentary at best. Using Bard, then ChatGPT4, I was able to generate the following SQL query to generate the histogram.
CREATE VIEW PrefixCounts AS
	SELECT
			prefix,
			section,
			COUNT(name) AS image_count
	FROM
			images
	GROUP BY
		section,
			prefix;

CREATE VIEW RangesB AS
	SELECT
		prefix,
		image_count,
		FLOOR(image_count / 10)*10 AS lower_bound
	FROM
			PrefixCounts
	WHERE section = 'B'
	AND
			image_count < 1000;

SELECT
	lower_bound || '-' || (lower_bound + 9)::TEXT AS image_range,
	COUNT(DISTINCT prefix) AS num_prefixes,
	SUM(image_count) AS total_images
FROM
	RangesB
GROUP BY
	lower_bound
ORDER BY
	lower_bound;
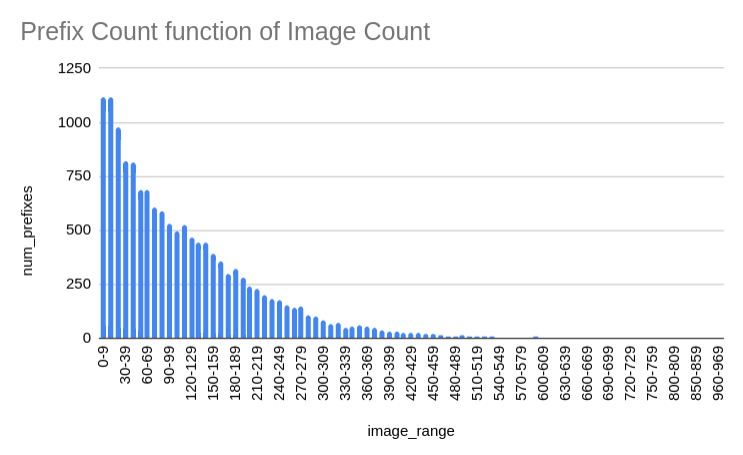
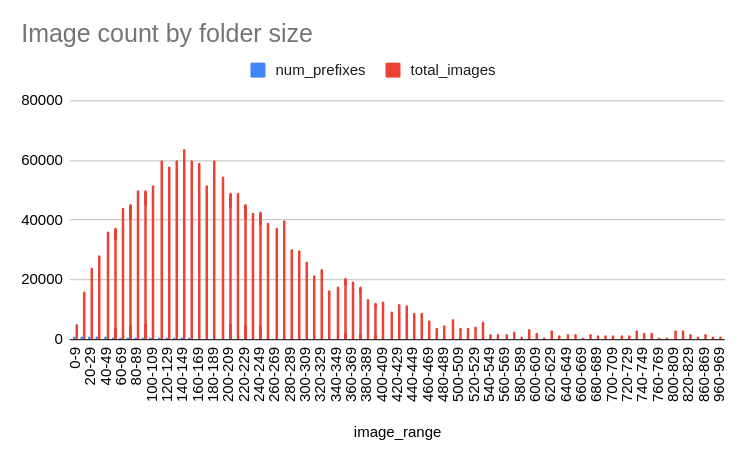
Exporting to CSV and plotting in a Google Sheet resulted in the following histograms (note that these are for Group B only):
 Prefix Count function of Image Count shows the number of prefixes that have a given number of images. These are grouped by 10s. For example, there are 1117 prefixes that have between 1 and 9 images. There are 494 prefixes that have between 100 and 109 images, and so on.
 Image count by folder size provides the sum of images across all prefixes that have a given number of images. For example, the 1117 prefixes that have between 1 and 9 images contain a total of 5303 images. There are 51574 images contained in the 494 prefixes that have between 100 and 109 images, and so on.
Projected OCR Costs
Using the results above the following cost estimates were obtained. If it is truly possible to aggregate images from a folder into batches of 10 then cost should also be reduced by a factor of 10. This would bring the total cost down to ~$361.35. These estimates exclude aggregating images for prefixes that have 1-9 images.
| Prefix | Img Count | Est. OCR | Est. aggr. OCR |
|---|---|---|---|
| A | 48126 | $106.62 | |
| B | 1667500 | $2,508.72 | $257.57 |
| C | 278891 | $435.37 | |
| D | 121977 | $183.00 | |
| E | 209391 | $319.05 | |
| F | 40301 | $60.45 | |
| G | 215 | $0.32 | |
| ———— | ——————- | ————– | ————- |
| Total | 2366401 | $3,613.53 | ~$360 |